- Published on
How to Invest for the Macro Environment (Permanent Portfolio in 2024)
The popular wisdom is stocks for the long run. That has worked phenomenally well over the last 100+ years for US investors (we are sitting at all-time highs as I write this!), But tucked into those decades of compounding are occasional periods of significant underperformance. But as the saying goes, there's always a bull market somewhere. Different asset classes and even different stocks can and often do perform well when the broader market is weak. That's the essence of diversification and any macro regime-based investing strategy. So, how should we think about creating a portfolio that performs in all economic seasons?
As always nothing is financial advice. Just trying keep it light, sling some charts and data for the brain to snack on.
In this post we’ll give you a primer on how to approach macro environment-aware investing. We'll explore:
- What it means to have a macro environment-aware investment strategy
- How to visualize the macroeconomic cycle
- Bucketing asset performance based on regime
- Offensive vs. Defensive approaches
- Offensive: Construct a portfolio concentrated to the prevailing macro environment
- Assumes that a) regimes are forecastable, and b) asset returns within regimes are stable
- Choose assets with the highest expected returns (tough to do well because market returns are non-ergodic)
- Defensive: Construct a diversified portfolio with assets that expected to perform across all macroeconomic regimes
- Assumes asset returns within regimes are broadly stable
- This usually means implementing some version of Harry Browne's Permanent Portfolio (25% stocks, 25% bonds, 25% gold, 25% cash).
- Some enhancements worth considering to bring the Permanent Portfolio concept into 2024: commodity trend following, tail risk, crypto, non-recourse leverage, equal risk-weighting instead of equal dollar weighting.
- Offensive: Construct a portfolio concentrated to the prevailing macro environment
Table Stakes – Visualizing the Economic Cycle
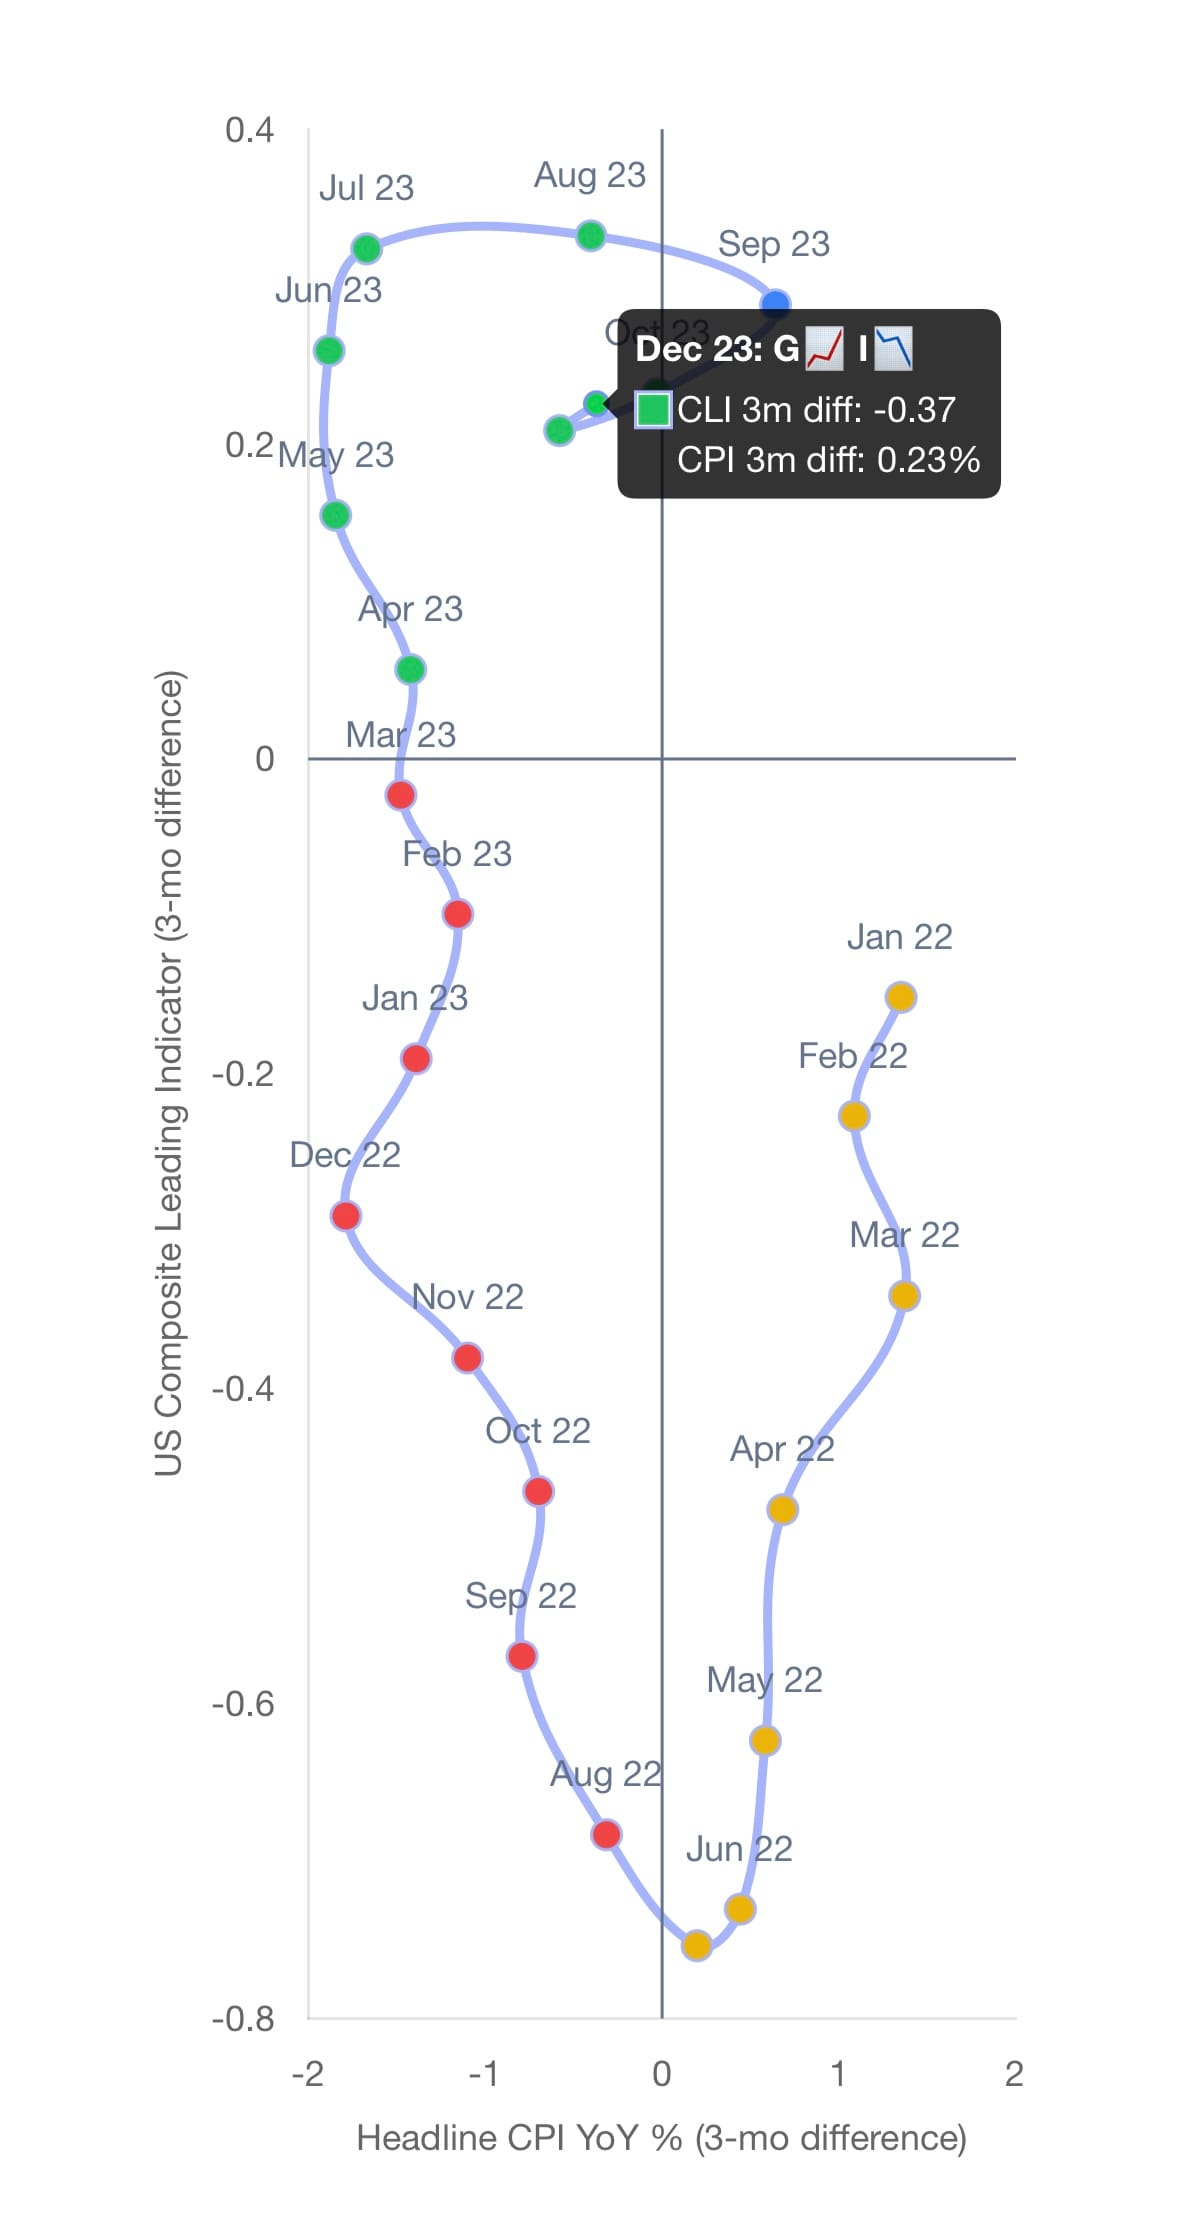
Regardless of whether you're playing offense or defense, the first step is to create and visualize your economic regimes. There are plenty of different ways to carve time into regimes, but the simplest and most popular is to create a 2x2 matrix measuring growth and inflation. This leaves you with four regimes:
- Growth Accelerating 📈, Inflation Decelerating 📉
- Growth Accelerating 📈, Inflation Accelerating 📈
- Growth Decelerating 📉, Inflation Accelerating 📈
- Growth Decelerating 📉, Inflation Decelerating 📉
Even here there are dozens of ways you could measure it. We like the OECD US Composite Leading Indicator as our growth proxy because of its monthly frequency, and Headline CPI to get the broadest measure of price pressure in the economy. Since markets respond to changes and not levels, we measure the 3-month change. The result is the smooth ebb and flow through the regimes you see above.
(By the way, that screen grab comes from our Macro Regime Analysis page. We update the dashboard as soon as new data becomes available.)
Some quick context behind the regimes. It should come as no surprise that the first two growth accelerating regimes make up the bulk of the investor experience. These are periods of economic prosperity, abundant capital, and strong labor markets. Stocks and anything "long GDP" tend to rip!
The third regime is the classic stagflationary period. The inflationary episode of 2022 is the most recent example (yellow dots in bottom right quadrant).
Lastly we have the fourth regime – the stick in between the bike spokes. This regime represents a deflationary and often recessionary environment. Liquidity dries up, people get laid off, the market crashes, etc. Think 1929, 2008, 2020. While these periods account for the least time, they often inflict the most pain on investors. This is where sequence of returns risk haunts people.
Imagine working for 30+ years, diligently squirreling away $2 million in your retirement accounts, anticipating $80,000/year at a 4% withdrawal rate to fund your retirement lifestyle. If you retire during one of these regimes, portfolio balls long in stocks and other "long GDP" assets, and the market dumps 40% (not uncommon), you are faced with a brutal red pill/blue pill scenario.
Red pill – Maintain your sustainable 4% withdrawal rate and be forced to live off of $48,000/year.
Blue pill – Maintain your $80,000/year lifestyle funded by selling your principal and risk running out of money before you run out of time.
Brutal!
As we’ll see though, some assets survive and even thrive in those scenarios. Exposure to those at the right time can limit drawdowns, smoothing out your return stream over time. This can potentially improve your wealth compounding over time. Especially on a risk-adjusted basis.
Okay we've sliced time into some neat little economic boxes, now what?
The next step is to calculate the return series of any asset you're interested in and bucket them based on your regimes. Then you can calculate any number of performance metrics and start comparing assets across their regimes and to each other within the same regime.
You can start to see the different behaviors percolate up. Market noise looking modestly less random.
Take the S&P 500 ETF (SPY) for example.
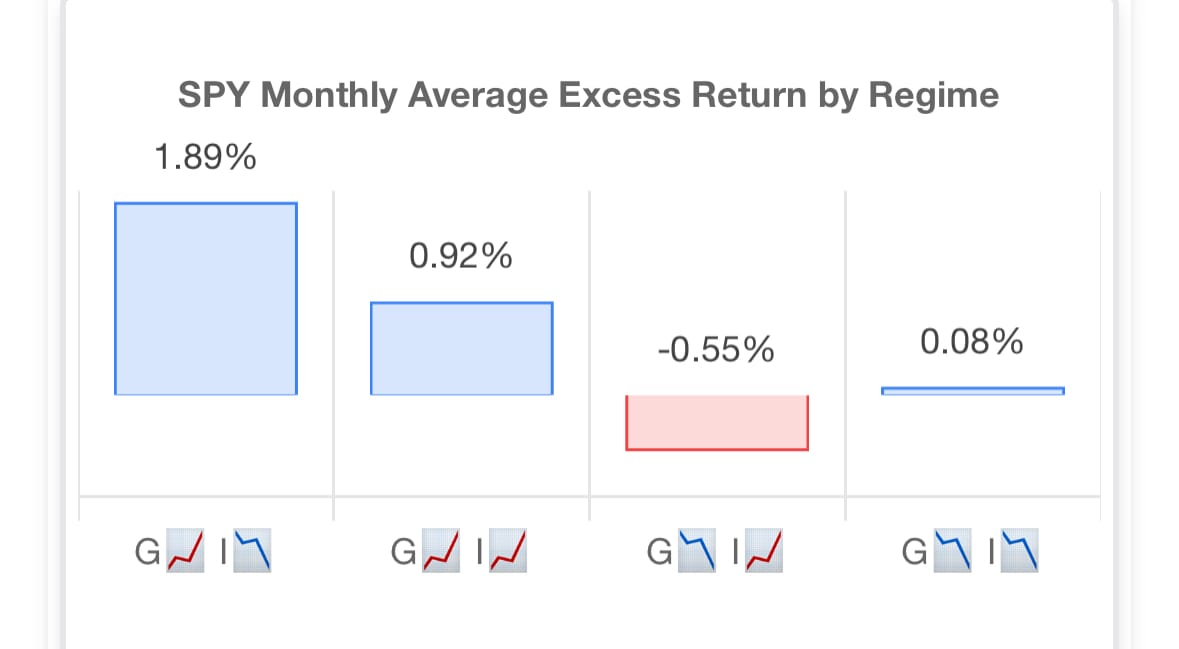
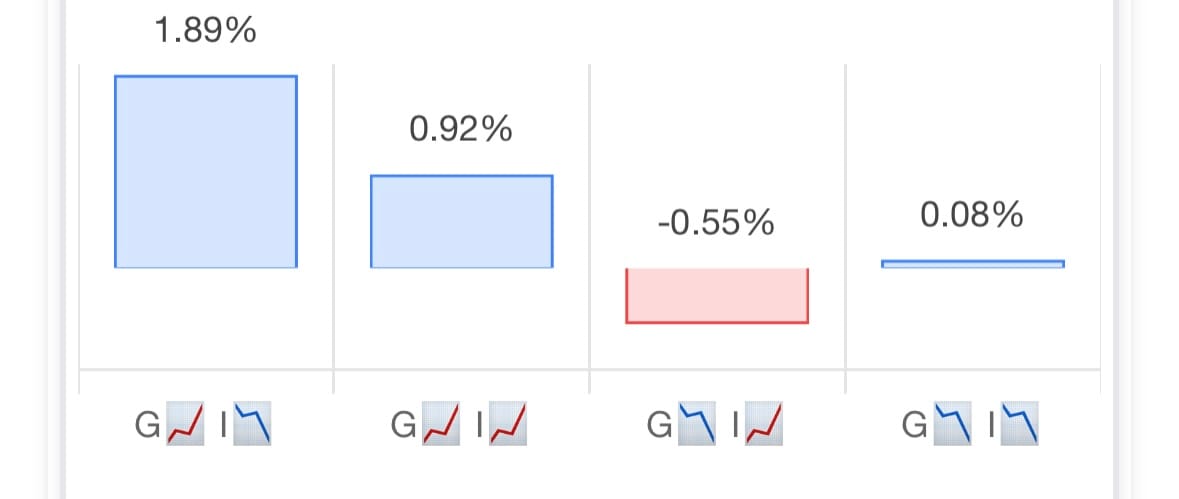
When the economy is growing (G📈), SPY has returned between 0.9% and 1.9% in excess of the the risk free rate (3-month T-Bills). That's before including dividends. Contrast that to the decelerating growth (G📉) regimes where the monthly average excess price return was flat to down 0.50%.
Pretty intuitive. Of course the averages do conceal some nuance. For example, the deflationary fourth regime average is roughly nil, but living through that you would've experienced absolute shellackings like spring-summer 2008, or March 2020. You also would've experienced some face ripping rallies, like the PPP/stimmie fever dream of mid-2020.
The point is, no crystal ball here – just trying to slightly shift the odds in our favor. Get a feel for when we're more likely to be rowing against the current than with it.
Long term treasury bonds are the classic example of assets that thrive in the opposite regimes. Growth down, rates cut, bond prices up.
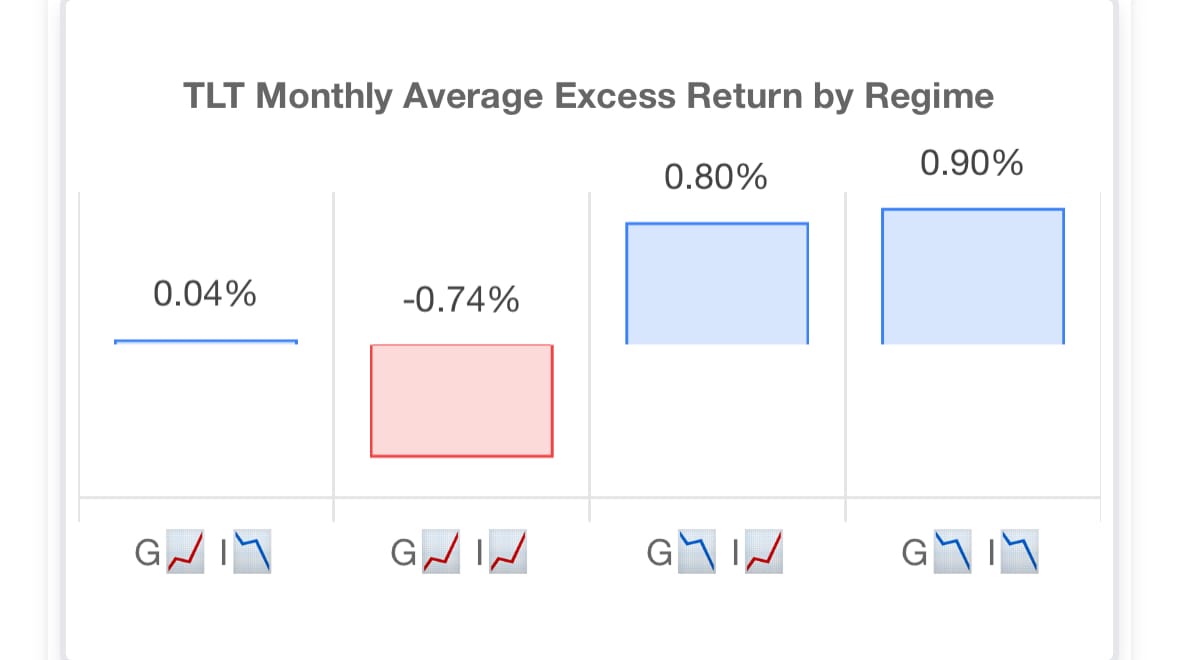
Note, we intentionally are just looking at price return here. Dividends/interest not included. We want to isolate the returns directly generated from changing market sentiment.
Offense vs. Defense
Not gonna spill a ton of digital ink on offense. To many variables to contend with here:
- Risk tolerance (how concentrated the portfolio will be)
- Investment universe (eg. trad, crypto)
- etc.
But the premise is simple (not easy!):
- Measure and forecast the economic regime
- Bias your portfolio to assets expected to outperform in the prevailing economic environment.
We built the Macro Regime Analysis + Permanent Portfolio Tools to help evaporate some of the fog of war here. We can at least measure the prevailing regime from the previous month (working on a real-time model!), and then give you a stack rank of the top performing assets in each regime. You can filter between trad, crypto, US sectors, EM countries, and more to see how these thematic baskets perform across regimes.
Clicking a bar will take you to the asset's ticker page where you can see more detailed regime report cards.
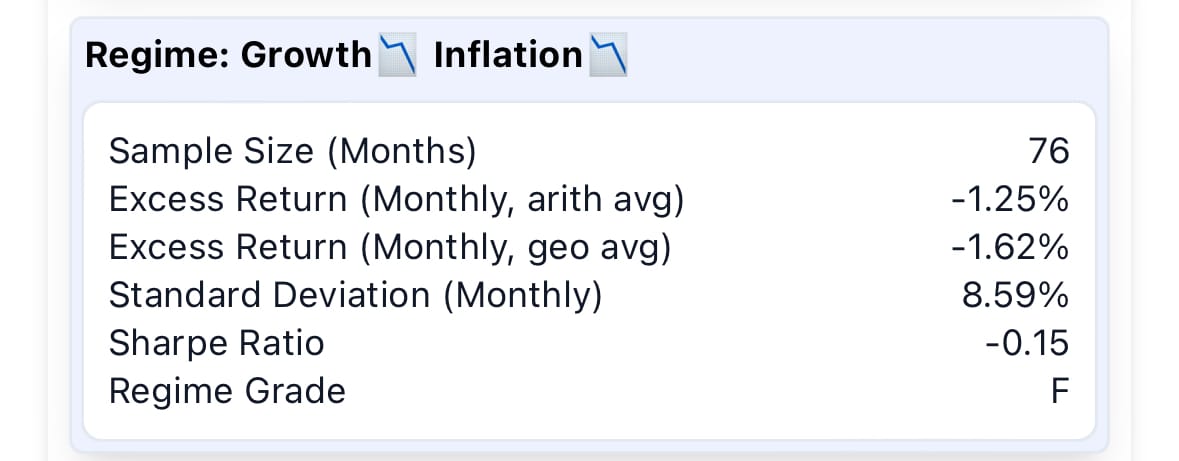
How neat is that? Admittedly biased, but we haven't seen anything like this, usually the macro research gurus hide it behind a paywall. They take you for a spin here and there but never hand you the keys.
Our tool is free. Here are the keys.
Let's shift gears and talk defense.
The defensive approach to investing for the macro environment involves constructing a portfolio designed to perform reasonably well regardless of regime. Hold complimentary assets that hand-off the performance baton like a relay team. Each regime a new leg.
The origin of this concept in modern investing is Harry Browne's Permanent Portfolio. Stocks for growth, Gold for inflation, bonds and cash for deflation. Equal dollar weight between the four.
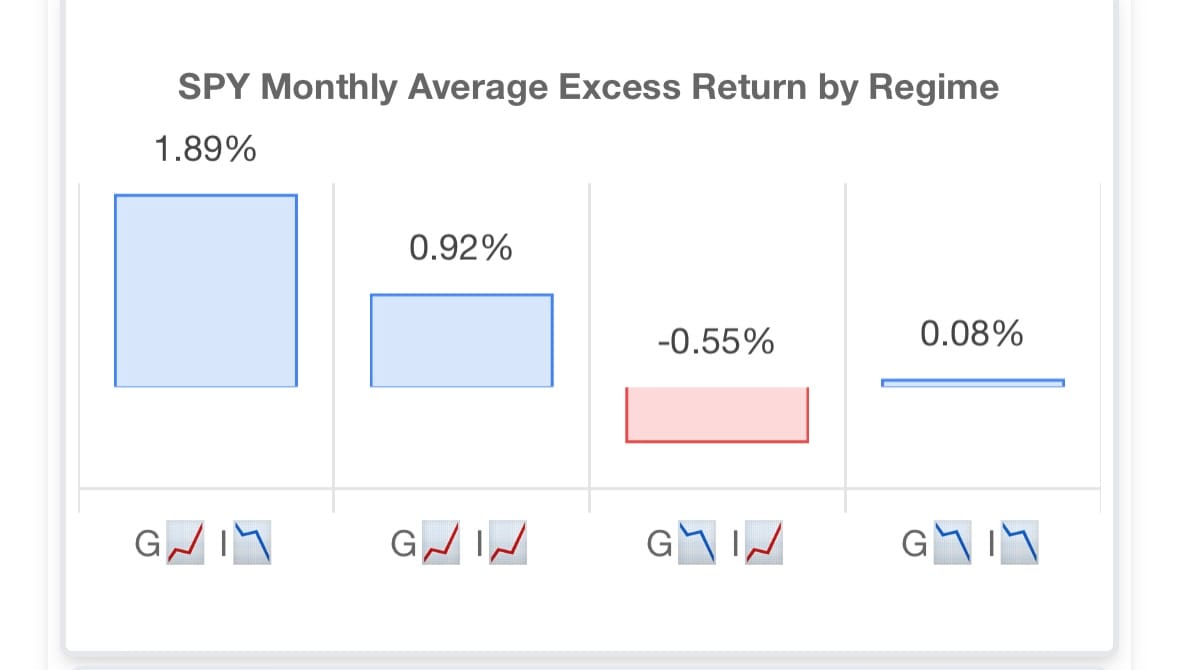
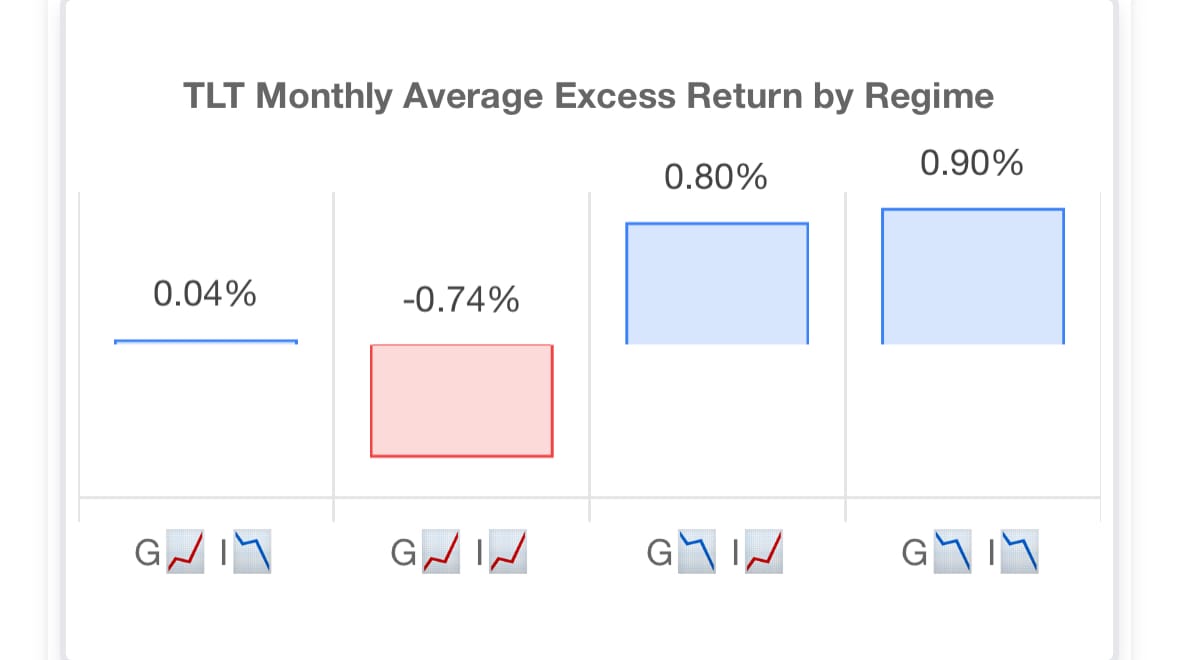
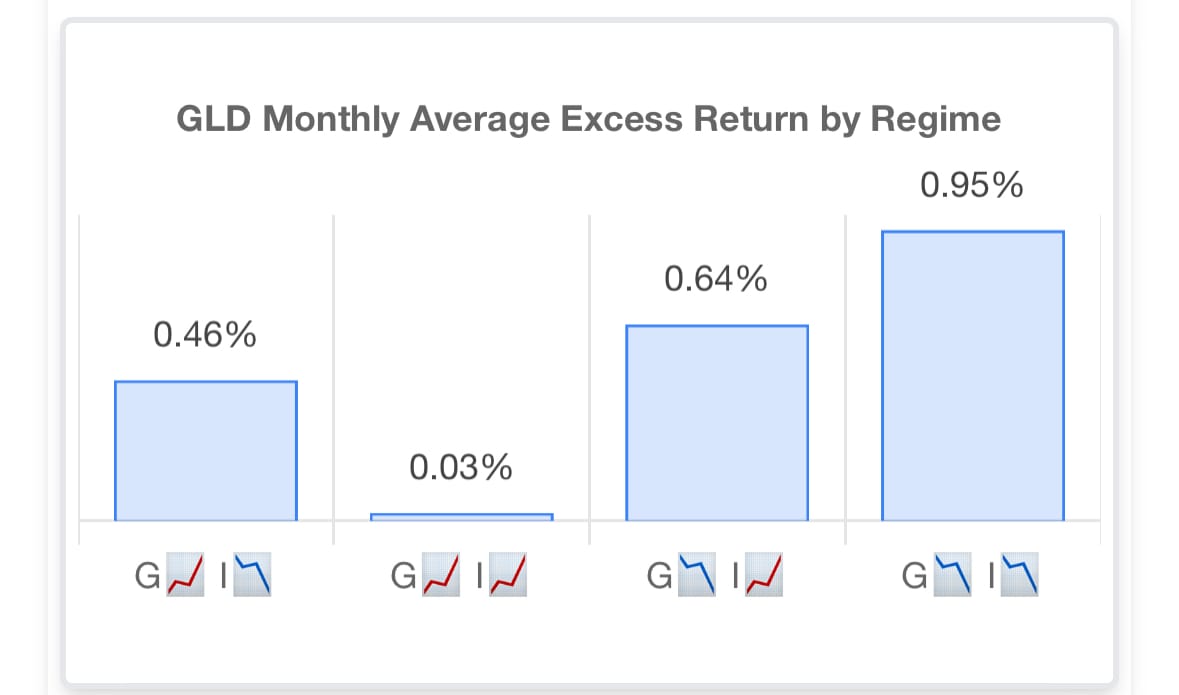
Like positions on the field, assets can play different roles in a portfolio.
Looking at all three together, you can visualize how the baton gets passed. While the absolute level of returns might dilute a bit lower, we now have exposure to to positive expected returns in all four regimes!
Browne‘s original implementation of stocks, bonds, gold, cash remains a solid foundation. But its 2024. The universe of investable assets and strategies has exploded. The level of portfolio sophistication available to the average investor has increased an order of magnitude, all while transaction costs have fallen by the same or more.
What could we do to bring the Permanent Portfolio into 2024 while still retaining its original essence?
- Add commodity exposure. Gold was the original inflationary regime position. It’s certainly better than nothing, but we can improve. Commodity prices are more directly correlated with inflation than gold (more correlated with real interest rates). ETF’s like DBMF, HARD, and CTA offer exposure to commodity trend following strategies.
- Tail risk protection. Cash was the original deflationary regime safety net, but recent rule changes opened the door for more complex derivatives to be included in ETF’s. For example, Simplify’s CYA employs a rolling put strategy to maintain constant downside protection. By definition this negatively correlated with long equities. It also exhibits positive convexity (capped downside, uncapped upside). Shout out to Mutiny Funds‘ Cockroach Portfolio for the inspirado. Luckily now there are innovative ETF’s jailbreaking this strategy beyond just accredited investors.
- Crypto. Regardless of your stance on the digital asset ecosystem, crypto could be a unique role player in our modern PP implementation. Hypersensitive to growth and liquidity, historically crypto returns have been highly correlated with equities, albeit with a higher beta. Higher beta just means it trades like levered equities. Perhaps a portion of the equity bucket could be replaced with a sleeve of computer coins? More juice, less squeeze. Do you, but we would be sticking to the majors here (BTC, ETH)
- Speaking of leverage… The ability for ETF’s to hold futures and other derivatives offer investors access to the all the leverage of futures, without the risk of ruin. Yes the volatility still works in both directions, but unlike futures you’ll never get margin called for holding an ETF. For our PP, we can consider adding leverage in the bond bucket. For example, TUA offers roughly $5 of exposure to the 2 year maturity for every $1 held. TYA offers similar exposure in the ten year. Unique new offerings around the concept of return stacking are worth considering too. For example, each dollar invested in RSST offers $1 of S&P 500 exposure, and $1 of exposure to a commodity trend following strategy. Similarly, RSSB pairs that same dollar of equity exposure with $1 invested in treasury bond futures. Or combine bonds and commodity trend via RSBT. That extra dollar can then be reallocated to a different, ideally uncorrelated return stream. Capital efficiency!
- Smarter rebalancing. We could consider switching from a naive equal dollar weight to a more volatility-aware equal risk weighting strategy. To go along with that, we might also consider a more frequent rebalancing, particularly in a tax-advantaged account.
So where might that leave us? A modern incarnation of the Permanent Portfolio could be an equal risk/volatility-weighted allocation of:
(Current weights as of writing calculated using the trailing 30-day volatility.)
Here's a quick snapshot of this mix, rebalanced weekly against SPY to start the year.
| 1/2/24 - 2/23/24 | Excess Total Return | Volatility | Sharpe Ratio |
|---|---|---|---|
| Modern PP 1 | 3.6% | 2.6% | 1.40 |
| SPY | 6.3% | 4.6% | 1.36 |
Not a meaningful sample, but it does broadly highlight how we'd expect this portfolio to perform. Sacrifice some return in exchange for lower volatility. The kicker being that when the regime shifts, the performance gap will likely. When stocks get taken to the woodshed, this diversified portfolio should continue to deliver modest returns on lower volatility. The tortoise and the hare in portfolio form.
Quick aside. Due to its design as a pure hedge, the tail risk (CYA) product is best implemented by rebalancing to a fixed dollar weight in the portfolio (eg. a typical institutional tail hedging allocation can be around 2%). It is constantly spending option options. In non-volatile markets, that option premium will decay over time. In a volatile market, the portfolio weight could increase by multiples (you can see these spikes on the chart), at which point you'd sell back down to 2% and reinvest the cash across the other holdings.
While we would consider this an advanced tactic for someone with lower risk appetite (DYOR, NFA, etc.), we still wanted to touch on it to highlight the democratization of these sorts of strategies in recent years. Previously advanced tail risk hedging was only the purview of institutional and accredited investors, now those same capabilities are available to all investors. Here for it.
We're going to track some different implementations including these over the next year and see how they stack up versus both the classic PP and the S&P 500. Stay tuned!
Woof. That was a lot. Again none of it is financial advice! Keeping it casual and informational over here.
Quick recap... We covered:
- What it means to have a macro environment-aware investment strategy
- Offensive and defensive regime-based investing frameworks
- How to visualize the macroeconomic cycle
- Bucketing asset performance based on regime
- Modern enhancements to the Permanent Portfolio
If you haven't already, check out our macro regime asset analysis tool.
cheers,
macro sherpa
